With SQL Server, there are several ways to fetch an execution plan. The two most important methods are:
- Graphically
The graphical representation of SQL Server execution plans is easily accessible in the Management Studio but is hard to share because the predicate information is only visible when the mouse is moved over the particular operation (“hover”).
- Tabular
The tabular execution plan is hard to read but easy to copy because it shows all relevant information at once.
Graphically
The graphical explain plan is generated with one of the two buttons highlighted below.
The left button explains the highlighted statement directly. The right will capture the plan the next time a SQL statement is executed.
In both cases, the graphical representation of the execution plan appears in the “Execution plan” tab of the “Results” pane.
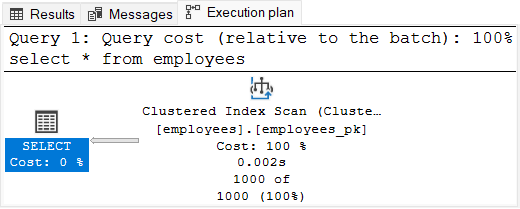
The graphical representation is easy to read with a little bit of practice. Nonetheless, it only shows the most fundamental information: the operations and the table or index they act upon.
The Management Studio shows more information when moving the mouse over an operation (mouseover/hover). This makes it hard to share an execution plan with all its details.
If you like this page, you might also like …
… to subscribe my mailing lists, get free stickers, buy my book or join a training.
Tabular
The tabular representation of an SQL Server execution plan is fetched by profiling the execution of a statement. The following command enables it:
SET STATISTICS PROFILE ONOnce enabled, each executed statement produces an extra result set. select statements, for example, produce two result sets—the result of the statement first then the execution plan.
The tabular execution plan is hardly usable in SQL Server Management Studio because the StmtText is just too wide to fit on a screen.

The advantage of this representation is that it can be copied without loosing relevant information. This is very handy if you want to post an SQL Server execution plan on a forum or similar platform. In this case, it is often enough to copy the StmtText column and reformat it a little bit:
select COUNT(*) from employees;
  |--Compute Scalar(DEFINE:([Expr1004]=CONVERT_IMPLICIT(...))
       |--Stream Aggregate(DEFINE:([Expr1005]=Count(*)))
            |--Index Scan(OBJECT:([employees].[employees_pk]))
Finally, you can disable the profiling again:
SET STATISTICS PROFILE OFF